Search This Blog

Tuesday 5 December 2017

Fibre and the risk of Type 2 Diabetes - the InterAct meta-analysis

Recently the Australian government publicised claims generated by Nutrition Australia, in an opinion paper funded by Kellogg's, that Australians increasing their cereal fibre intake could reduce the cost of CVD and diabetes to the Australian economy:

This research demonstrates that if Australian adults use grain fibre to increase their intake of dietary fibre to target intake levels for chronic disease risk reduction (28g for women, 38g for men):
• The potential healthcare expenditure savings would be approximately $1 billion for CVD and over $285 million for T2D in 2015–16. The savings for CVD would represent approximately 0.6% of total Australian health expenditure and savings for T2D would be around 0.2% of health expenditure.
• The potential productivity cost savings were estimated to be approximately $600 million for CVD and $1.4 billion for T2D. The savings for CVD represent approximately 0.04% of gross domestic product (GDP) and for T2D, approximately 0.08% of GDP.
The total combined economic savings could potentially reach $3.3 billion.


Zoe Harcombe looks into the evidence base here and finds it lacking; however as her article requires a subscription and she asked me to look at the evidence to try to make sense of some convoluted manipulations, I'm going to discuss some extra aspects of the main type 2 diabetes study used, the EPIC-InterAct study and its meta-analysis.[1]

This paper presents the results from a large multicentre epidemiological study from the EPIC cohorts, followed by what is supposed to be a meta-analysis of prospective epidemiological studies (more on that later).The EPIC-InterAct data is the "news" here, and it doesn't support the hypothesis that cereal fibre prevents type 2 diabetes when adjusted for age and sex, or for "lifestyle, diet and BMI" but does in the purely lifestyle and diet adjusted models.
However, if we look at the forest plot, we can see that the associations are all over the place, and there are many countries without a protective association, including France with a non-significant HR of 1.72. Another outlier is the UK with an HR of 0.74 (NS).

What are the differences in these populations? The French cohorts, for some reason, are all 100% female, which isn't the case for any other country. And the largest of the two UK cohorts is EPIC-Oxford.[2]
"The majority of participants recruited by the EPIC Oxford (UK) centre consisted of vegetarian and “health conscious” volunteers from England, Wales, Scotland, and Northern Ireland"
So these health conscious volunteers are probably being compared with people with lower fibre intakes in the less health-conscious UK cohort.
Sweden always interests me because one of their two cohorts is the Malmo Diet and Cancer Study, which uses a 7-day food diary for all subjects, and in Sweden the HR is a more reasonable 0.96. So less confounding by conscientiousness and more accurate diet recall tends to minimize the cereal fibre and type 2 diabetes association. If cereal fibre prevented type 2 diabetes in any important way, it should show up in most of these populations, not just a few.

The InterAct authors then follow up this rather inconsistent evidence by including it in a meta-analysis of all other prospective cohort studies on the question. This is an example of advocacy epidemiology - our study didn't convincingly support our belief, so we'll incorporate it into the totality of less relevant evidence that does. Presumably an intention of InterAct is to inform European dietary recommendations, for which the European evidence is most relevant, and for which it seems to say that the effect of cereal fibre on type 2 diabetes risk depends a great deal on what country you're a citizen of, so cannot be guaranteed either way.

Lo and behold the larger meta produces the strongly supportive associations that informed the Australian Kellogg's paper.
But hang on.
At least one of the studies included, the Finnish Diabetes Prevention Study, isn't a prospective cohort study at all - it's a mixed intervention of diet and exercise advice vs no intervention.
This simply should not have been included. It's a small study so shouldn't have biased the result too much if at all, but it doesn't inspire confidence that the selection of studies for inclusion was as rigorous as it should have been. (It's discussed and excluded from an analysis in a supplementary paper, so this isn't an error).
There are 3 Australian studies, two small ones with protective associations and a large one, Hodge 2004, with none.[3] However Hodge 2004 finds that white bread is associated with type 2 diabetes, and that lower GI carbs, including sugar, aren't. White bread in Australia is so bad that even sugar looks good by comparison. Does it follow that putting a few grams of bran in white bread will improve it? Why not just say "avoid white bread"? Anyway, if fibre isn't associated with type 2 diabetes in a fairly large sample of Australians, who as Zoe Harcombe pointed out tend to have fairly high fibre intakes anyway by OECD standards, why do Aussies need to take their lead from the USA?
Because most of the weighty studies in favour of fibre for type 2 diabetes prevention in the meta-analysis come from the USA. There are two important facts about the USA - low fibre intakes are lower than they are anywhere else (so basically a high intake of deep fried food, white breads, and soda in these groups), and conscientiousness is an identifiable confounding factor in many populations. For example, the Nurses' Health Study and Health Professionals' Follow-up Study; here we have the populations not only given the most advice about fibre being healthy, but also given the job of passing it on to the other US populations. In other words, grain fibre - like red meat - is one of the signifiers separating conscientious Americans from other Americans (it's harder to eat fruit and vege without their fibre, and vege in the US includes fried potatoes). It's almost a class distinction.


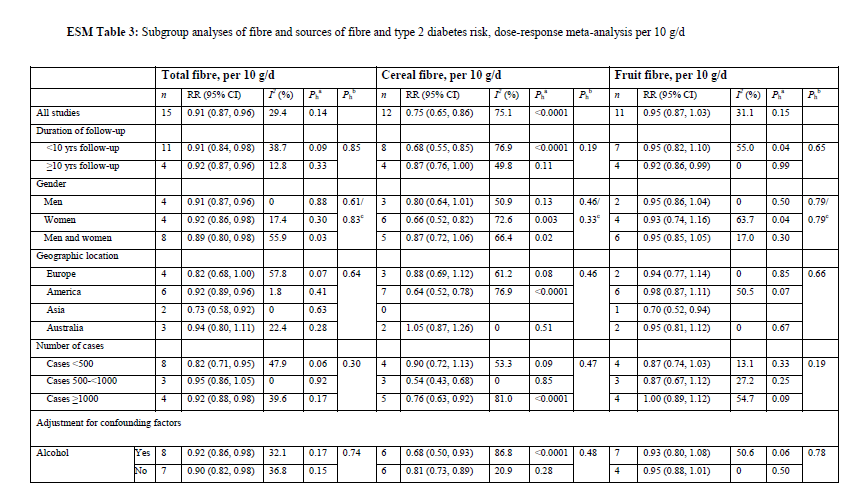
Look at this subgroup analysis of the "dose response" (ESM Table 3) - it's ALL about the USA. Zoe and I couldn't get our heads around how this "dose-response" was calculated from such diverse studies that all had differing groupings and cut-offs, but even taken at face value, why would an Australian government claim it showed any health savings for Australians?
If we compare diabetes prevalence between countries with mean fibre intakes, the USA with its abnormally low fibre intake for a high-cereal society fits, but other countries don't.
"The mean±SD fibre intake in the subcohort was 22.9± 6.2 g/day (ranging from 19.9 g/day in Sweden to 25.2 g/day in Denmark; data not shown)."
Germany (7.40%) and Denmark (7.20%) have higher diabetes prevalence rates than Sweden (4.70%).  USA's mean total fibre intake is 16.1 g/day and diabetes prevalence is 10.80%.
Germany and Denmark were the other populations in EPIC-InterAct where fibre had some protective association with type 2 diabetes. I'm not sure about T2D, but the amount of wholegrain associated with a modest degree of ischaemic CVD protection in Malmo was only 2.5 servings a day, and there was a protective association between fibre (mostly cereal) and saturated fat (a high SFA, high fibre diet was the most protective combination).[4,5]
We are probably seeing - in all these studies - a protective effect of eating high quality food with a minimal human interference factor (dairy and ryebread in Scandinavia) and belonging to the social class that is more likely to do this. With regard to iCVD bran may be a "failsafe" source of silicon, needed for vascular resilience and repair (you can get silicon from other foods and water, but bran in a staple food would guarantee it was present in the diet), but it is hard to see how this applies to T2DM. If a microbiotal mechanism was strongly involved, presumably other types of fibre would be more protective than they are. I come back to what whole grains are not. They are not white bread, and what is white bread? It used to be made with alloxan, a chemical used to produce experimental diabetes in animals. Today it contains

INGREDIENTS:  White Bread (Enriched Wheat Flour (Flour, Malted Barley Flour, Niacin, Iron(Ferrous Sulfate, Reduced Iron), Thiamine Mononitrate, Riboflavin, Folic Acid), Water, Yeast, Salt, Soybean Oil, Sugar, Malt, Dough Conditioners(Ascorbic Acid, Calcium Sulfate, Sodium Stearoyl Lactylate),Calcium Propionate(To Retard Mold Growth))
ALLERGENS:  Wheat, Soybeans, Gluten

This Harvard-supplied list is incomplete - NZ white bread contains soy protein; Tip Top's omega 3 loaf supplies;

Wheat Flour, Water, Soy Fibre, Baker's Yeast, Wheat Gluten, Vinegar, Iodised Salt, Vegetable Gum (412), Soy Flour, Canola Oil, Tuna Oil (0.05%) (Contains Fish, Soy), Milk Protein (Sodium Caseinate), Emulsifiers (481, 471, 472e), Vitamins (Thiamin, Folate, Vitamin E, Niacin, Vitamin B6), Minerals (Iron, Zinc).

Woah - the fibre isn't even grain fibre, and there are 3 emulsifiers. Emulsifiers are experimentally linked to obesity and diabetes.
So it's hard to rule out that whole grains just tend to replace a cause of type 2 diabetes in some societies.
So, if you're an American eating a lot of starch from fibre-free foods, replacing these with whole grain foods (which for one thing won't be cooked in oil) should decrease your risk of type 2 diabetes. Replacing them with anything closer to nature will likely have the same effect.
If you're a European, Brexit will be bad news, because you won't be able to move to the one place where fibre is really protective, but you can still go to Sweden and enjoy the best of both worlds.
If you're an Australian, ask yourself, do I eat like the average American who isn't health conscious? If the answer is yes, then sprinkling a bit of bran on your food won't save you. But if you avoid bread or cereals altogether, are you at extra risk of type 2 diabetes? That's what we really want to know, and what none of the epidemiology can tell us at all, unless it's the risk marker epidemiology, which as far as I know says low TG/HDL, high LDL, low HbA1c = lowest T2DM risk.

References

[1] The InterAct Consortium. Dietary fibre and incidence of type 2 diabetes in eight European countries: the EPIC-InterAct Study and a meta-analysis of prospective studies. Diabetologia. 2015;58(7):1394-1408. doi:10.1007/s00125-015-3585-9.ghbhttps://www.ncbi.nlm.nih.gov/pmc/articles/PMC4472947/

[2] The InterAct Consortium, Langenberg C, Sharp S, et al. The InterAct Project: An Examination of the Interaction of Genetic and Lifestyle Factors on the Incidence of Type 2 Diabetes in the EPIC Study. Diabetologia. 2011;54(9):2272-2282. doi:10.1007/s00125-011-2182-9.

[3] Hodge AM, English DR, O'Dea K, Giles GG. Glycemic index and dietary fiber and the risk of type 2 diabetes. Diabetes Care. 2004;27:2701–2706. doi: 10.2337/diacare.27.11.2701
[4] Wallström P, Sonestedt E, Hlebowicz J, et al. Dietary Fiber and Saturated Fat Intake Associations with Cardiovascular Disease Differ by Sex in the Malmö Diet and Cancer Cohort: A Prospective Study. Obukhov AG, ed. PLoS ONE. 2012;7(2):e31637. doi:10.1371/journal.pone.0031637.

[5] Sonestedt E, Hellstrand S, Schulz C-A, et al. The Association between Carbohydrate-Rich Foods and Risk of Cardiovascular Disease Is Not Modified by Genetic Susceptibility to Dyslipidemia as Determined by 80 Validated Variants. Müller M, ed. PLoS ONE. 2015;10(4):e0126104. doi:10.1371/journal.pone.0126104.


Monday 31 July 2017

Low fat dairy recommendations for children completely lack an evidence base, to put it mildly


"There is no finer investment for any community than putting milk into babies."

— Sir Winston Churchill (1874-1965) Radio broadcast (March 21, 1943)


After reading about the Toddler Paradox on the Care Factor Critical blog, I wondered what evidence was cited in New Zealand to support recommendations for low fat milk, lean meat, and so on in the diets of children. These recommendations were revised in 2015, so should be based on up-to-date science. And, if not, they should at least be based on science, right? Totality of the evidence and all that - if there's evidence that bears directly on the question, it should be cited?

Not in the background document for these recommendations - none of it is cited. Perhaps because none of it supports the recommendations? Surely not. Perhaps because the scientists signing off on the document were too busy to check? Who knows.

Here is the background document:


Ministry of Health. 2012. Food and Nutrition Guidelines for Healthy Children and Young People (Aged 2–18 years): A background paper – Revised February 2015. Wellington: Ministry of Health.
https://www.health.govt.nz/system/files/documents/publications/food-nutrition-guidelines-healthy-children-young-people-background-paper-feb15-v2.pdf

It contains the following statement, reinforced - with great specificity - in all menu examples –

Reduced- and low-fat milk is suitable for children aged two years and over, as long as growth is occurring normally. Therefore, it is recommended that children transition from standard homogenised (dark blue) milk to low-fat (green or yellow) milk from two years of age.


1) The Boyd Orr Cohort is selectively cited

There are few if any relevant citations in the document - the Boyd Orr cohort is interesting because it follows the long-term health of children raised in an era - the 1930's - when many fatty animal foods were considered health foods. Sources of saturated fat in these diets were dairy and meat, and tallow used for deep frying in in fish and chip shops, which were the only fast food outlets. There are two relevant Boyd Orr papers, but only one, from 1998, was cited.


[1] Gunnell DJ, Frankel SJ, Nanchahal K, et al. 1998. Childhood obesity and adult cardiovascular mortality: a 57-year follow-up study based on the Boyd Orr cohort. American Journal of Clinical Nutrition 67: 1111–18. LINK
Is cited to support the claim that childhood obesity increases the risk of cardiovascular disease and early mortality.

Compared with those with BMIs between the 25th and 49th centiles, the hazard ratio (95% CI) for all-cause mortality in those above the 75th BMI centile for their age and sex was 1.5 (1.1, 2.2) and for ischemic heart disease it was 2.0 (1.0, 3.9)


However the 2005 Boyd Orr cohort paper relating to saturated fat intake and cardiovascular and all-cause mortality was not cited.

[2] Ness AR, Maynard M, Frankel S, et al. Diet in childhood and adult cardiovascular and all cause mortality: the Boyd Orr cohort. Heart. 2005;91(7):894-898. doi:10.1136/hrt.2004.043489.

In this paper fat and saturated fat were not associated with the outcomes attributed to obesity in the earlier paper, and were non-significantly protective, making it unlikely that higher fat and saturated intake in this cohort either contributed to childhood obesity or had any adverse effect on the outcomes strongly associated with childhood obesity, i.e. all-cause mortality and cardiovascular disease.


The age, energy, and sex adjusted rate ratio between the highest and lowest quartiles of total fat intake was 0.89 (95% CI 0.46 to 1.72, p for trend 0.80). The fully adjusted rate ratio between the highest and lowest quartiles of total fat intake was 0.87 (95% CI 0.38 to 2.00, p for trend 0.80). The age, energy, and sex adjusted rate ratio between the highest and lowest quartiles of saturated fat intake was 0.70 (95% CI 0.38 to 1.29, p for trend 0.30). The fully adjusted rate ratio between the highest and lowest quartiles of saturated fat intake was 0.62 (95% CI 0.28 to 1.37, p for trend 0.30).

The 2005 Boyd Orr cohort paper bears directly on recommendations made often in the 2015 document and is from a body of research which was found evidential enough to be included as the 1998 paper; it should have also been included.


2) observational studies on low fat vs whole milk and dairy in children

No papers were cited in the document that directly support (or otherwise directly relate to) the recommendation to drink “Low fat calcium enriched milk” in place of whole milk.

There are, as well as relevant papers that were available at the time of writing the document, also more recent papers showing that whole milk consumption is associated with leaner BMI in children.


[3] Vanderhout SM, Birken CS, Parkin PC, Lebovic G, Chen Y, O’Connor DL, Maguire JL; TARGet Kids! Collaboration. Relation between milkfat percentage, vitamin D, and BMI z score in early childhood. Am J Clin Nutr 2016;104:1657–64. LINK

Among the 2745 included children there was a positive association between milk-fat percentage and 25(OH)D (P = 0.006) and a negative association between milk-fat percentage and zBMI (P less than 0.0001). Participants who drank whole milk had a 5.4-nmol/L (95% CI: 4.32, 6.54) higher median 25(OH)D concentration and a 0.72 lower (95% CI: 0.68, 0.76) zBMI score than children who drank 1% milk. Milk volume consumed modified the effect of milk-fat percentage on 25(OH)D (P = 0.003) but not on zBMI (P = 0.77).”

The following paper is important for ruling out a role of reverse causation in the others.


[4] Prentice P, Ong KK, Schoemaker MH, et al. Breast milk nutrient content and infancy growth. Acta Paediatrica (Oslo, Norway : 1992). 2016;105(6):641-647. doi:10.1111/apa.13362.


Higher HM TCC was associated with lower 12‐months body mass index (BMI)/adiposity, and lower 3–12 months gains in weight/BMI. HM %fat was inversely related to 3–12 months gains in weight, BMI and adiposity, whereas %carbohydrate was positively related to these measures. HM %protein was positively related to 12‐months BMI.”


[5] Rolland-Cachera MF, Maillot M, Deheeger M, Souberbielle JC, Peneau S, Hercberg S. Association of nutrition in early life with body fat and serum leptin at adult age. Int J Obes (Lond) 2013;37:1116–22. LINK

In adjusted linear regression models, an increase by 100 kcal in energy intake at 2 years was associated with higher subscapular skinfold thickness (β=6.4% SF, 95% confidence interval 2.53–10.30, P=0.002) and higher FFM (0.50 kg, 0.06–0.95, P=0.03) at 20 years. An increase by 1% energy from fat at 2 years was associated with lower subscapular skinfold thickness (−2.3% SF, −4.41 to −0.18, P=0.03), lower FM (−0.31 kg, −0.60 to −0.01, P=0.04) and lower serum leptin concentration (−0.21 μg l−1, −0.39 to −0.03, P=0.02) at 20 years."


[6] Alexy U, Sichert-Hellert W, Kersting M, Schultze-Pawlitschko V. Pattern of long-term fat intake and BMI during childhood and adolescence—results of the DONALD study. Int J Obesity Relat Metab Dis. 2004;28: 1203–9. LINK

The mean BMI during the study period differed significantly, with the highest BMI in the low fat intake cluster.

Consistent with a review of the evidence in adults

[7] Kratz M, Baars T, Guyenet S. The relationship between high-fat dairy consumption and obesity, cardiovascular, and metabolic disease. Eur J Nutr. 2013;52:1–24. LINK


The observational evidence does not support the hypothesis that dairy fat or high-fat dairy foods contribute to obesity or cardiometabolic risk, and suggests that high-fat dairy consumption within typical dietary patterns is inversely associated with obesity risk.”

One Brazilian study which could be interpreted as supporting the recommendation - though it is at best ambiguous - found that higher full-fat dairy consumption was associated with higher triglycerides in obese and overweight children eating fewer servings of full-fat diary than recommended in that country. However no comparison with low-fat dairy was available. Saturated fat and full-fat dairy were not associated with higher LDL cholesterol (non-significant correlation of full-fat dairy with lower LDL, multivariate linear regression coefficient −0.38 (−0.77;0.01) p=0.06)

[8] Rinaldi AEM, de Oliveira EP, Moreto F, Gabriel GFCP, Corrente JE, Burini RC. Dietary intake and blood lipid profile in overweight and obese schoolchildren. BMC Research Notes. 2012;5:598. doi:10.1186/1756-0500-5-598.


3) trial evidence.


Few trials have tested the effect of increasing fat and saturated fat from dairy in the diets of children, due to current recommendations to do the opposite. However the available example shows that this does not result in harm in the context of a nutritionally adequate diet.

[8] van der Gaag EJ, Wieffer R, van der Kraats J. Advising Consumption of Green Vegetables, Beef, and Full-Fat Dairy Products Has No Adverse Effects on the Lipid Profiles in Children. Nutrients 2017, 9(5), 518; doi:10.3390/nu9050518.


"In children, little is known about lipid profiles and the influence of dietary habits. In the past, we developed a dietary advice for optimizing the immune system, which comprised green vegetables, beef, whole milk, and full-fat butter. However, there are concerns about a possible negative influence of the full-fat dairy products of the diet on the lipid profile. We investigated the effect of the developed dietary advice on the lipid profile and BMI (body mass index)/BMI-z-score of children. In this retrospective cohort study, we included children aged 1–16 years, of whom a lipid profile was determined in the period between June 2011 and November 2013 in our hospital. Children who adhered to the dietary advice were assigned to the exposed group and the remaining children were assigned to the unexposed group. After following the dietary advice for at least three months, there was a statistically significant reduction in the cholesterol/HDL (high-density lipoproteins) ratio (p < 0.001) and non-HDL-cholesterol (p = 0.044) and a statistically significant increase in the HDL-cholesterol (p = 0.009) in the exposed group, while there was no difference in the BMI and BMI z-scores. The dietary advice has no adverse effect on the lipid profile, BMI, and BMI z-scores in children, but has a significant beneficial effect on the cholesterol/HDL ratio, non-HDL-cholesterol, and the HDL-cholesterol."

The diet advice in this trial also resulted in a decrease in respiratory infections, possibly an outcome of interest with regard to the New Zealand population and the incidence of rheumatic fever.

Thus it appears that the Ministry of Health document was prepared without a proper literature search, and that no-one involved in the 2015 version was familiar with the extensive literature regarding a specific recommendation that was being made.

I'm aware that there are controversies in nutrition science, but this does not appear to be one. The evidence is all on one side, and yet it is being ignored by people who think they know better.

With what results we see.


Saturday 3 June 2017

Gilbert's Syndrome - a user's guide

Last week I received some liver test results from my last follow-up visit to Auckland Clinical Services after clearing HCV genotype 3 in the Phase 3 Epclusa trial mentioned here.

ALT and AST were gratifying low at 12 and 15 U/L respectively, albumin healthy at 45 g/L, but total bilirubin was high at 23 umol/L despite direct bilirubin being low at 3 umol/L. The normal reference range for total bilirubin is 3-21 umol/L.
I've seen this before in LFT results and been told that it's consistent with Gilbert's syndrome, and I know that my brother has been told that he has Gilbert's syndrome. I vaguely remembered something about Gilbert's syndrome being a protective factor for heart disease. This meant nothing to me when I had no way of assessing this sort of health claim, but I thought it was worth looking into. And what I found was surprising - not only is the Gilbert's association real, but bilirubin level across the whole range may be something worth including in risk calculations.

In the first paper I found, the incidence of IHD was 2% in the Gilbert's sample, 12% in the case-matched general population.[1] The Gilbert's population had higher HDL but "According to linear discriminant analysis, hyperbilirubinemia rather than elevation of HDL cholesterol levels seemed to be more important in protection from IHD." The elevated antioxidant status in the Gilbert's cases would help to explain the higher (and probably more functional) HDL anyway.


Franchini et al have supplied an excellent review of the Gilbert's CVD link; their paper is a model of clarity in writing and layout.[2] Bilirubin is a breakdown product of heme, supposed by some authors to be the lethal ingredient in the toxic food red meat. However I could find no evidence that heme intake relates to meat intake, and have heard of vegans with Gilbert's syndrome. Indeed the Paleo Ketogenic Diet researchers have used an all-meat diet to manage an extreme case of Gilbert's syndrome (there is such a thing as excessive bilirubin, but this is not usually what is meant by Gilbert's Syndrome in adults).[3]

One of the most heartening findings is that not only Gilbert's syndrome but also higher bilirubin within the normal range is associated with independence in the elderly.[4]
"The OR of functional dependence for each standard deviation increment in the serum total bilirubin level was 0.56 (P = 0.002). After additional adjustment, the inverse association remained essentially unchanged. In quartile-based analysis, participants with higher quartiles of serum total bilirubin tended to have lower ORs of functional dependence. The trends of lower likelihood of functional dependence across increasing quartiles of the serum total bilirubin level were statistically significant (P= less than 0.05 for all trends)."
Bilirubin tends to increase with age and is not associated with reduced mortality over the age of 70 (but who cares if you're functionally independent). However, it's likely that survivor bias also applies. Bilirubin might even explain the changing LDL-associated risk in the elderly - because those with lower bilirubin were more likely to have had heart attacks when younger, and bilirubin rises with age, a healthy older population may have a higher % of people with Gilbert's syndrome or higher bilirubin and be protected from oxidised LDL and thrombosis, the two main benefits of higher bilirubin.
That Gilbert's syndrome also protects against platelet hyperactivity and thrombosis supports the various CVD hypotheses of Malcolm Kendrick and Gregory D. Sloop.[5]

Elevated levels of bilirubin are associated with reduced risk of cardiovascular disease especially in Gilbert's syndrome.
- Platelet hyper-activity due to oxidative stress increases the risk of thrombosis, and therefore myocardial infarction.
- Bilirubin may inhibit platelet activity by interacting with collagen and ADP receptors, or by improving resistance to oxidative stress.
- Inhibiting platelet activity may represent one mechanism to explain protection against cardiovascular disease leading to mortality in mildly hyperbilirubinemic individuals.

Bilirubin is a lipid soluble antioxidant which is easily recycled via biliverdin reductase.
"Bilirubin protects polyunsaturated fatty acids from lipid peroxidation, thus preventing damage by reactive oxygen species to cell membranes and proteins."[6]
Gilbert's syndrome is associated with a lean phenotype. Is this because of its inhibitory effect on omega-6 peroxidation? It is also associated with a reduced risk of NAFLD and type 2 diabetes.


However, Gilbert's syndrome has a dark side; the reduction in glucuronidation that results in elevated bilirubin can also alter estrogen metabolism and has been associated with an increased risk of hormone-sensitive breast cancer.[7]
"Patients with Gilbert syndrome have an impaired function of the enzyme UGT1A1, responsible for the degradation of 4-OH-estrogens. These elements are produced by the degradation of estrogens and are well-known carcinogens. In theory, patients with Gilbert syndrome accumulate 4-OH-estrogens and, therefore, might have a higher risk for breast cancer, especially when exposed to higher levels of estrogens."
In fact, because CVD is more of a risk for men, and women can expect longer lives in any case, the benefits of Gilbert's syndrome are probably not spread equally between the sexes. Avoidance of alcohol, which is estrogenic and associated with breast cancer risk, might be more important in women with Gilbert's.

A further risk with Gilbert's syndrome is that impaired function of the enzyme UGT1A1 means that some drugs, including acetaminophen (paracetamol) will be more active and there is theoretically a lower safety margin.[8] However the antioxidant activity of bilirubin may render this point moot with regard to acetaminophen, if not other drugs.

In any case bilirubin, especially if it can be assessed from more than one blood draw, and is not likely to be affected by drugs or liver disease, seems like something that should be used in risk assessment. There is, for example, probably not much point in prescribing a statin to someone with high bilirubin, not that there is any point in prescribing statins to healthy people anyway.


Can bilirubin be hacked? Phycobilin from algae such as spirulina, and phytochrome from green leafy vegetables, are analogous chemicals with similar properties, but will be less effective if they are not recycled by biliverdin reductase.

References


[1] Vítek L, Jirsa M, Brodanová M, Kalab M, Marecek Z, Danzig V, Novotný L, Kotal P. Gilbert syndrome and ischemic heart disease: a protective effect of elevated bilirubin levels. Atherosclerosis. 2002 Feb;160(2):449-56.

[2] Franchini M, Targher G, Lippi G. Chapter 3 – Serum Bilirubin Levels and Cardiovascular Disease Risk: A Janus Bifrons? Advances in Clinical Chemistry. 2010. 50; 47–63.

https://www.dropbox.com/s/nzhg9llideyg91d/franchini2010.pdf?dl=0

[3] Tóth C, Clemens Z. Gilbert’s Syndrome Successfully Treated with the Paleolithic Ketogenic Diet. American Journal of Medical Case Reports 2015; 3(4): 117-120.
http://pubs.sciepub.com/ajmcr/3/4/9/

[4] Kao TW, Chou CH, Wang CC et al. Associations between serum total bilirubin levels and functional dependence in the elderly. Intern Med J, 2012; 42: 1199–1207. doi:10.1111/j.1445-5994.2011.02620.x
http://onlinelibrary.wiley.com/doi/10.1111/j.1445-5994.2011.02620.x/abstract

[5] Kundur AR, Singh I, Bulmer AC. Bilirubin, platelet activation and heart disease: A missing link to cardiovascular protection in Gilbert's syndrome? Atherosclerosis. 2015; 239(1): 73–84.
http://dx.doi.org/10.1016/j.atherosclerosis.2014.12.042


[6] Läer S, Apel M, Bernhardt J, Kapitulnik J, Kahl R. Interactions between bilirubin and reactive oxygen species in liver microsomes and in human neutrophil granulocytes. Redox Rep. 1997; 3(2):119-24. doi: 10.1080/13510002.1997.11747098.
[7] Astolfi RH, Bugano DD, Francisco AA et al.Is Gilbert syndrome a new risk factor for breast cancer? Medical Hypotheses. 2011; 77(2): 162-164. 
(See also https://www.dropbox.com/s/cfoadvmigzozymw/Breast%20Cancer%20AA.pdf?dl=0 )

[8] de Morais SM, Uetrecht JP, Wells PG. Decreased glucuronidation and increased bioactivation of acetaminophen in Gilbert's syndrome. Gastroenterology. 1992; 102(2):577-86.


Thursday 18 May 2017

Fruit and Diabetes - some evidence

It's a commonly discussed paradox of sorts - how can fruit have a negative association with diabetes in epidemiology when it's full of sugar?

Two recent papers from China go some way towards clearing this up in my opinion. One is a prospective study of Type 2 Diabetes risk, in which a difference is seen between different classes of fruit; apples are good, tropical fruits - pineapples, mangos, and bananas are not, but the effect is staggered by gender.[1]

Results: In 494,741 person-years of follow-up, 5207 participants developed T2DM. After adjustment for lifestyle and dietary risk factors, high total fruit consumption was not consistently associated with lower T2DM risk [men: HR of 1.33 (95% CI: 1.04, 1.71) for 3 or more servings/d compared with less than 1 serving/wk (P-trend = 0.17); women: HR of 0.88 (95% CI: 0.71, 1.11) (P-trend = 0.008); P-interaction = 0.003]. The direct association in men was observed for higher–glycemic index (GI) fruit [HR: 1.51 (95% CI: 1.22, 1.86) for 1 or more serving/d compared with rarely consumed; P-trend = 0.001] but not for lower or moderate GI fruit. In women, the consumption of temperate fruit, but not of subtropical or tropical fruit, was associated with lower T2DM risk [HR: 0.79 (95% CI: 0.67, 0.92) for 1 or more serving/d compared with rarely; P-trend = 0.006].

Conclusions: The consumption of temperate fruit, such as apples, was associated with a lower risk of T2DM in women, whereas the consumption of higher-GI fruit, such as bananas, was associated with higher risk in men. The impact of fruit consumption on the risk of diabetes may differ by the type of fruit, which may reflect differences in the glycemic impact or phytochemical content.

A second Chinese paper looked at fruit consumption in the second trimester and risk of gestational diabetes.[2] (This was posted by gestational diabetes expert Lily Nichols @LilyNicholsRDN on her blog)

As epidemiology goes, this paper has signs of class - look at table 1, where they have actually gone to the trouble to check that their respondents are representative of the whole population canvassed by giving the baseline characteristics of the people who didn't want too be in the study, who are well-matched with the people they included. This is textbook stuff, but I can't remember the last time I saw it done. Fruit intake was fairly high - 740g a day in the upper quartile.

An increase in total fruit consumption during the second trimester was associated with an elevated likelihood of GDM (highest vs. lowest quartile: crude OR, 3.20; 95% CI, 1.83 to 5.60). After adjustment for age, education, occupation, income level, pre-pregnancy BMI, gestational weight gain, family history of diabetes, smoking status and alcohol use in Model 1, a significantly higher likelihood of GDM was still observed in the third and fourth quartiles for total fruit consumption (OR 2.81; 95% CI 1.47 to 5.36; OR 3.47; 95% CI 1.78 to 6.36, respectively). After adjustment for potential confounding factors in Model 1 plus the consumption of grain, vegetables, meat and fish, the ORs for the lowest to the highest quartiles of fruit consumption were 1.00 (reference), 1.08 (95% CI 0.50 to 2.34), 3.03 (95% CI 1.54 to 5.94) and 4.82 (95% CI 2.38 to 9.76), respectively.

These are some huge ORs - what about type of fruit?

Comparison of fruit subtypes revealed that a greater consumption of pome fruit was associated with a lower likelihood of GDM (crude OR 0.59; 95% CI 0.37 to 0.96). The OR of GDM in the highest tertile of pome consumption was almost half that in the lowest tertile. However, the association attenuated to null after adjusting for potential confounding factors in Models 1, 2 and 3. Compared with the lowest tertile, the second tertile for consumption of gourd fruit was inversely associated with the likelihood of GDM, but this inverse association was neither observed in the highest tertile nor in the overall trend (P trend = 0.346). The adjusted ORs in Model 3 across the lowest to highest tertiles of fruit consumption were 1.00 (referent), 0.27 (95% CI 0.11 to 0.66) and 0.94 (95% CI 0.45 to 1.95), respectively. In contrast, compared with the corresponding lowest tertiles, the highest tertiles for consumption of citrus and tropical fruit were each related to a higher likelihood of GDM (adjusted OR in Model 3, 2.26; 95% CI 1.29 to 3.99; adjusted OR in Model 3, 3.73; 95% CI 1.74 to 8.01, respectively). Berry consumption was initially positively associated with GDM, but this association was attenuated to null in Model 3 (highest vs. lowest tertile in Model 3: OR, 1.69; 95% CI 0.80 to 3.56).

Ignore the berry association, it's obvious from the CIs that people didn't eat enough berries to give much of a result. But pomes are apples and pears, and again they look good. Why?

They also assessed the results by GI:

The increased consumption of fruit with moderate to high GI values was significantly associated with a higher likelihood of GDM. Compared with the lowest quartile, the highest quartile for consumption of fruits with moderate to high GI was associated with a higher likelihood of GDM (crude OR 3.04; 95% CI 1.80 to 5.06; adjusted OR in Model 3, 2.94; 95% CI 1.47 to 5.88).

High GI fruits were pineapple, mango, citrus. The authors hypothesised about effects of polyphenols, but this didn't really go anywhere.
Here's what I think; apples and pears are the only fruits you can't juice with your bare hands. When you eat an orange, you're swallowing juice and pulp separately. When you eat an apple, you're still swallowing them together, mostly. And this, I think, is what makes the difference. It takes longer for the sugar to appear in your blood, so people with an already impaired phase 1 insulin response are less affected by it, and the slower digestion produces a more satiating and less insulinogenic gut hormone response.
Of course it's possible that people with a sweet tooth ate the sweeter fruit and that a sweet tooth indicates some sort of internal starvation predictive of diabetes, but even so, eating the sweeter, juiceable fruit is not going to help.

The amount of fruit associated with a lower risk of diabetes in meta-analysis, as with pome fruit here ("one or more serving/day") is relatively low and would fit in many low carb diets (the same is true of wholegrains and legumes - the studies that say that these foods are associated with protection don't say that very high intakes are needed at all). Not that this effect, whatever it is, would be important or needed in a low carb diet, but it is available unless your preferred carb intake is under 50g. If people do include sweet or starchy carbs in their diet, the types of carbs are important.
Very important.

Also see Gannon and Nuttall's study comparing a 40% carb diet high in intrinsic sugars (fruit, milk, root veges) with a 60% carb diet high in starch.[3]


[1] Alperet DJ, Butler LM, Koh W-P et al. Influence of temperate, subtropical, and tropical fruit consumption on risk of type 2 diabetes in an Asian population. Am J Clin Nutr. 2017: ajcn147090
http://ajcn.nutrition.org.sci-hub.bz/content/early/2017/02/07/ajcn.116.147090.short?rss=1&related-urls=yes&legid=ajcn;ajcn.116.147090v1

[2] Huang W-Q, Lu Y, Xu M, Huang J, Su Y-X, Zhang C-X. Excessive fruit consumption during the second trimester is associated with increased likelihood of gestational diabetes mellitus: a prospective study. Scientific Reports. 2017;7:43620. doi:10.1038/srep43620.
https://www.ncbi.nlm.nih.gov/pmc/articles/PMC5341573/


[3] Gannon MC, Nuttall FQ, Westphal SA, Fang S, Ercan-Fang N. Acute metabolic response to high-carbohydrate, high-starch meals compared with moderate-carbohydrate, low-starch meals in subjects with type 2 diabetes. Diabetes Care. 1998 Oct;21(10):1619-26.
https://www.ncbi.nlm.nih.gov/pubmed/9773720


Monday 8 May 2017

A Quick note on the ASCOT-LLA "Nocebo" statin side-effects study

Here's a comment I put on Malcolm Kendrick's post about the "statin side effects minimal" Lancet paper.
For what it's worth, there's evidence that lipid lowering is effective in secondary prevention of CVD, but only in people with lipid markers associated with hyperinsulinaemia.
This is an easy syndrome to correct without drugs. In people without hyperinsulinaemia (shown by high HDL level and low TG/HDL ratio) placebo is just as effective as any lipid lowering meds for secondary prevention of CVD.


The comment:

I tried to understand the ASCOT-LLA Nocebo study. It had an inherently high potential to be unethical and irresponsible, either because its agenda was to discourage side-effect reporting, or if not because its effect will be just that.

So it needed to be clear – it wasn’t clear at all.It needed to be open-access, something its millionaire backers could easily have afforded - it was instead behind a paywall, with only the media reports of its authors statements being free.

(Here it is)
It needed to be representative. To do that, it needed to collect baseline data about people who might have been in the study but weren’t – the people who didn’t respond to the invites, the people who were excluded, and the people who dropped out.
It may be there, but I can’t find it.
What I can find is that a high % of people in all arms of the study had already been on lipid lowering medicines. Other lipid lowering meds actually cause similar side effects to statins, and this probably included prior statin treatment too, so that would have screened out a lot of people who wouldn’t want to repeat the experience.
But also, the % of people who formerly took lipid lowering meds is highest in the arms with most reported side effects. So there can also be an exposure effect, the longer people are exposed to lipid lowering (those with immediate SFX having been screened out) the more likely it is that they will develop SFX. There’s no evidence that this possibility was controlled for, even though it seems perfectly obvious from the study design that the unblinded arm were on statins for longer than the blinded arm. (One of the few things that is obvious).
This is p-hacking a study of a low-dose intervention, for atorvastatin only, over 10 years after the fact to try to discredit people reporting side effects from the entire range of statins and dosage today.
As I said, it’s unethical to propose such a thing unless you’re proposing the perfect trial of it, which this is not.
You'd need a representative sample of drug-naive individuals prescribed a variety of drugs and doses, as in real life, to even begin. And that is the population reporting a high incidence of debilitating (and very specific) side effects; see the comments on the Malcolm Kendrick blog above.
Is it any wonder that people doubt the safety of basic things like vaccines and flouridation today, when this sort of bogus attempt at reassurance, which no-one trusts as far as they can throw it, is being encouraged in the mainstream medical journals?

Tuesday 2 May 2017

Bradford Hill is rolling in his grave

Austin Bradford Hill was, as should be well known, the father of modern epidemiology, who played a key role in determining a causal relationship between smoking and lung cancer.
His 9 criteria (or viewpoints, as he called them) for evaluating epidemiological evidence were only ever a suggestion, and intended to have adaptable interpretations strongly guided by logic and good sense in any given context, but have stood the test of time despite the best efforts of epidemiologists to abandon and undermine them.
Initially an attempt was made to reduce the criteria to a smaller number of more malleable points with more room for guesswork and consensus, in the name of getting on with the business of identifying risks however small.

More recently, perhaps due to criticism, the full 9 criteria have been revived, and two recent efforts see them ticked off pedantically - in contexts which might well have bemused Bradford Hill.

Firstly, and I will only touch on this briefly, we have the "LDL is causal in CVD" paper.[1] Bradford Hill probably never considered that a class of biological particles present in every human being could be the cause of a common disease that is seen in individuals with widely varying levels of these particles. It's a little bit like finding platelets causal in thrombosis.

But even so, the paper commits a cardinal error.
None of my nine viewpoints can bring indisputable evidence for or against the cause-and-effect hypothesis and none can be required as a sine qua non. What they can do, with greater or less strength, is to help us to make up our minds on the fundamental question – is there any other way of explaining the set of facts before us, is there any other answer equally, or more, likely than cause and effect?


Is there any other explanation? To determine this, you need to also test the likelihood of the known alternatives. This the authors of the LDL paper do not do. Their paper does not mention insulin, ferritin, or the differing atherogenicity of the different classes of LDL particle and other lipoprotein particles such as VLDL or small, dense HDL, nor the oxidation status of the LDL particles. This is as if Hill had looked at a factory where the workers had a high rate of an unusual cancer, had been told that the workers were exposed to three or more novel chemicals, but had only decided to test the associations for one of them (perhaps the chemical that the company paying his wages made an antidote for). They seem to be arguing for the existence of a biological pathway, which few doubt has some relevance, but overlooking much that is also relevant, such as that the risk associated with LDL will not be decreased if the number is lowered by a method that increases the atherogenicity of the particles, that the association with LDL becomes protective as people age, and that lower LDL levels predict decreased survival in hospital after a heart attack, which may be the reason the FOURIER trial found absolutely no benefit in terms of mortality from extreme LDL lowering.

I have no wish, nor the skill, to embark upon philosophical discussion of the meaning of ‘causation’. The ‘cause’ of illness may be immediate and direct; it may be remote and indirect underlying the observed association. But with the aims of occupational, and almost synonymous preventive, medicine in mind the decisive question is where the frequency of the undesirable event B will be influenced by a change in the environmental feature A.With this in mind, we turn to our second new paper, which seems to risk making an opposite set of mistakes.[2] In this paper, in which the causality of foods and nutrients in cardiometabolic diseases is considered using the Bradford Hill criteria, every possible factor is tested, and most of them are found to be causal.
Perhaps if you can use the Bradford Hill criteria to assert causation for 17 different factors in the same disease you have also refuted each of them individually.
But what's interesting is that, even with this drift-netting approach, saturated fat is no longer making an appearance. Unfortunately we seem to lack the analysis that actually shows saturated fat failing the Bradford Hill criteria, the whole thing's a bit hush-hush for some reason.
We also see that the strength of the association is rated weak for PUFA, which is as it should be.
However red meat gets into their sights, which is unfortunate as people don't eat nearly as much red meat as they used to, yet diabetes, one of the conditions attributed to it here, is very much on the rise.

Their interpretation of temporality in general is weak; as well as one thing preceding another, it ought to take into account where possible the effects of duration of exposure on a disease; there are aetiological aspects to temporality (such as latency in cancer diagnosis) that are more complex than a simple longitudinal relationship. Diabetes is a disease of civilisation and red meat is an ancient food, an aspect of temporality which we probably also need to consider.  

The analogies given in Table 2 are not all convincing, many of them seem to refer to other relationships in the table or other associations that are still unproven. Bradford Hill's idea of an analogy was thalidomide and birth defects, an undeniable example of causation.

If we look at the reference list, we see a fair few Mediterranean diet papers and Harvard epidemiology papers featuring cohorts who were told that avoiding red meat was a healthy behaviour; in fact the sole evidence for the "red meat/processed meat and diabetes" claims is the Pan et al paper from 2011.[3] However 3 of the 10 studies in the Pan et al meta-analysis are their own NHS, NHS2 and HPFS studies, which use a cumulative averaging system that may give false results and data from a population of health professionals known to be influenced by advice about healthy behaviours (including advice given publicly by the study authors). If we remove (or combine) these 3 studies (all published together in this one paper) and combine the two Steinbrecher papers for males and females in the same population, we have 2 of 6 (or 7) favourable studies and 4 (or 5) unfavourable, a ratio which no longer meets the authors' test of consistency. In any case meta-analysis is a way of forcing the appearance of strength and consistency where neither may exist; it is probably most useful where exposures in a number of small, underpowered trials are identical (e.g. the same dose of the same drug for the same condition), and much less useful in diet epidemiology, with its already large populations and its data collection uncertainties.

If we turn to table 4 we see something alarming.[2] The recommended intake of PUFA is set at 11% of energy. This necessitates the use of oils. Yet only one country in the world has a PUFA intake this high - Bulgaria, where the age adjusted death rate for CHD is 188.45 per 100,000 of population ranking Bulgaria #21 in the world. Poland, a somewhat comparable country, sets a recommended PUFA intake of 3% (real intakes are higher) and has 136.72 CHD deaths per 100,000, placing at #40. The Tsimane' indians of Bolivia have very low PUFA intakes and experience a very low rate of cardiovascular disease, as do the Kitavans and as did the Tokelauan Islanders; high PUFA intakes are unusual in hunter-gatherers free from cardiometabolic disease. A PUFA intake of 11% is an unproven intervention, even the AHA doesn't recommend more than 10%.
The recommended meat intake of one serving a week is only met in Armenia and Georgia - two countries with very high CHD death rates. This is also a meat intake that will not supply nearly enough iron for women of childbearing age, ffs.
Barbados has the highest fruit consumption, as recommended, but diabetes is a major cause of death there.
This sort of arbitrary decision is not one that the use of Bradford Hill criteria allows anyone to make, especially when it is contradicted by this evidence supplied in the same table.


Such insanity aside, the dietary etiology Bradford Hill paper is probably intended as a well-meaning attempt to justify asking Americans to eat beans, nuts, and fish, which won't do them any harm; its danger is that it polishes up the Bradford Hill criteria into yet another tool that ideologues can use to suppress uncertainty, or justify the use of foods in contexts where they are biologically inappropriate (e.g. wholegrain products in the treatment of diabetes). If you don't respect the uncertainty in diet-health science, and the importance of context, you can't be right.

There's an earlier Bradford Hill dietary paper, by Andrew Mente and colleagues, which makes an interesting contrast with the current one.[4] Although in general agreement, albeit tougher, some associations that satisfy the criteria are for individual nutrients - vitamin E and vitamin C. In fact the vitamin E association is stronger than that for PUFA. Oils and other foods high in PUFA are generally good sources of vitamin E.

It may well be that sourcing expensive (or risky) foods and following exotic dietary patterns can protect us from disease. It may also be that the protective factors in foods are the ones we've always known about - the vitamins and minerals, electrolytes and trace elements, protein, essential fatty acids and so on, and that they do us most good when we find them in foods that won't dump energy into our bloodstreams any faster than the foods our ancestors ate thousands of years ago (which means that sourcing nutrients from fortified foods won't be optimal even if we could get the number of them and their balance right, which is far from being the case today). It may also be that other things in foods act as mild pseudomedicines (the polyphenols and other phytochemicals) or make up for deficiencies in our individual metabolisms (the carnochemicals).

This is what I propose as the null hypothesis of nutrition and health - that simple good feeding will give us most of the protection we need, that wandering away from it first with food refining and depletion, then with food processing (defined as the synthesis of replacements for degraded foods from more and more complex aggregations of equally refined food and non-food ingredients), is the cause of our modern cardiometabolic ills (insofar as these are due to diet and not other genetic and environmental factors) - not the fact that we instinctively cling to eating meat - the last surviving nutritious real food in all too many diets today.


References

[1] Ference BA, Ginsberg HN, Graham I et al. Low-density lipoproteins cause atherosclerotic cardiovascular disease. 1. Evidence from genetic, epidemiologic, and clinical studies. A consensus statement from the European Atherosclerosis Society Consensus Panel. Eur Heart J. 2017 Apr 24. doi: 10.1093/eurheartj/ehx144


[2] Micha R, Shulkin ML, Peñalvo JL, et al. Etiologic effects and optimal intakes of foods and nutrients for risk of cardiovascular diseases and diabetes: Systematic reviews and meta-analyses from the Nutrition and Chronic Diseases Expert Group (NutriCoDE). PLOSOne April 27, 2017 https://doi.org/10.1371/journal.pone.0175149


[3] Pan A, Sun Q, Bernstein AM, Schulze MB, Manson JE, Willett WC, et al. Red meat consumption and risk of type 2 diabetes: 3 cohorts of US adults and an updated meta-analysis. The American journal of clinical nutrition. 2011;94(4):1088–96. pmid:21831992


[4] Mente A, de Koning L, Shannon HS, Anand SS. A systematic review of the evidence supporting a causal link between dietary factors and coronary heart disease. Arch Intern Med. 2009 Apr 13;169(7):659-69. doi: 10.1001/archinternmed.2009.38.


Monday 1 May 2017

What I eat 2017

Another in the ever-popular genre of blog posts about what people eat.

No photos though.

I wake up and have an instant coffee with cream and 1/4 spoonful of dark brown sugar.

Maybe I'll have another before breakfast. If I'm out I'll have a long black with cream without sugar, followed by a glass of cold water.

Breakfast is the most important meal of the day, because it decides if and what you'll be eating before dinner. Usually after 10 AM.

My favourite breakfast is 4-5 eggs (depending on size) cooked in a mix of ghee and bacon fat. So I'm eating all the eggs whole, no yolk-only meals, and using less added fat than I did a few years ago.

The virtue of eating more eggs is that I can run further without my joints hurting. I could always run a mile, but the impact on my legs, feet, and ankles meant I couldn't do it the next day. Since increasing my egg intake, I find I can do it day after day (if I want to, sometimes I prefer to relax outside and take things in differently).

I might have leftovers of stir fry with a couple of added eggs, if it's there and I don't want to waste it, or frozen broad beans fried in bacon fat and ghee with a tin of sardine and a couple of eggs, if it's time for some omega 3s.

I'll usually add dried chilli flakes and some curry powder, and always salt.

I don't usually need to eat on days when I'm out of the house, in the city, but if I do it's usually some high-fat deli meat, maybe a piece of fruit.

In the afternoon at home, if I'm not too busy and feel the need, I'll have a small piece of tasty cheddar cheese, or a spoonful of pure peanut butter. If there's any fruit I'll have a couple of pieces. I prefer pears and plums, kiwis and feijoas. Apart from this and the trace element of sugar in coffee, no carbs (and almost always no starch) before dinner.

An hour before dinner on most afternoons I'll have a glass or two (standard serving) of red wine. I like chianti at the moment but whatever's both good and cheap. I started drinking regularly a year or so after I cleared Hep C with the Epclusa trial, and I like the effect, which is interesting because I used to be an alcoholic in the early 90's, but I'm quite sure I'm not anymore.

Dinner could be anything. These days either roast lamb or pork with roast veges, including some starchy carbs cooked in the fat or in beef and lamb dripping, or very spicy stir fry with mince or chicken and lots of veges, eaten with yoghurt and maybe some rice, maybe not. There might be a little sugar in curry pastes or pasta sauces, to be honest this concerns me a lot less than some other common additives like soy or cornstarch. So some days are less than 50g carbohydrate and some are less than 100g, rarely more. I no longer feel any different in my energy levels if I'm in or out of ketosis, expect that higher carbs make me feel overdone after a few days if I'm not exercising much, not that my weight changes, and I adjust back down. My favourite starchy dish is a bean salad, black beans with feta, tomato, vinegar and olive oil.

After dinner I'll have a cup of tea with some dark chocolate. If we don't have any, I'll eat sweet chocolate, but that is the sort of thing that can get away on me. If I need dessert I'll have berries and cream, or a roast apple with cream.

I'll also eat a little bit of cheese close to bedtime. Paradoxically, because I'm a little allergic to dairy and can't drink milk, this seems to stop me from getting hay fever when I'm trying to sleep. And it's good for my teeth - I lost most of these eating carbs, I realise now I could have stopped this at any time just by eating the way I do now. I have some surviving teeth with massive caries where mercury amalgam fillings inserted during childhood fell out due to further decay - these teeth are now hard again, have stayed the same for 6 or more years since going low carb, are still useful, and never hurt. This arrest of dental caries was first noted by Boyd in the teeth of children with diabetes maintained on very low carb diets in the 1920's. I have lived in an area without water fluoridation for the past 11 years.

Exercise is that of someone who has literally never been to a gym in his 59 years. And never been in team sports. In summer I swim in the sea and rivers - my stroke is lousy and slow but I'm finally confident to travel out of my depth for long periods. I climb hills, I run and sprint along the roads and paths, and test myself occasionally with runs up hill or for longer distances, but not every day. I can do 10 pull-ups from a dead hang at the local playground some days - I could never do that before, couldn't even do one a year or so ago. I can do all things I might need to do in my life without exhausting or injuring myself, which is my definition of fitness.

I use some supplements; vitamin D in winter (I average 5,000 IU/day from midwinter; sunlight withdrawal symptoms like psoriasis and optic twitch remind me when it's time to start), magnesium from time to time, grape seed extract at the moment, boron (as borax) which I've trialled for a couple of weeks and I quite like. Vitamin C occasionally.

In spring and summer I try to get enough sunlight exposure to tan early and often, this then allows me to go swimming etc ad lib with minimal use of sunscreen or risk of sunburn.


Tuesday 18 April 2017

Counsels of perfection

Counsels of perfection

A recent critique of the US dietary guidelines, which made some very good points about the failure to recommend that people stop eating processed foods, suggested that the phrase in the dietary guidelines “Consume less than 2,300 mg of sodium per day” be replaced with “Eat natural foods, meat, fish, eggs, dairy products, nuts and seeds and the natural sodium contained therein.” We have to disagree with this; natural foods (unless they include a large quantity of feta cheese and salted fish) may not supply adequate intakes of sodium for many; and, if people in New Zealand eat locally grown natural foods, and don't like or can't afford seafood, those who don't live in coastal areas may not have adequate intakes of iodine. We asked one of this paper’s authors about the iodine question (he lives in the USA) and he replied that pastured eggs could supply one’s iodine needs. This may well be the case, but, with all due respect as these are authors we usually agree with, and we certainly agree with the bulk of their critique, this part is not good enough for dietary guidelines or public health advice.

The phrase “counsel of perfection” comes from the early Church. All that was necessary for salvation was to follow the 10 commandments, but those who wanted to be perfect were counselled to also practice chastity, obedience, and poverty (in the sense of absolute charity). These things are desirable, but for practical purposes cannot be demanded of the faithful. In nutrition, there are also commandments, and there are counsels of perfection. Commandments include adequate intakes of the essential minerals, vitamins, and trace elements, protein, fats, fibre and energy, not eating too much, and in recent times eating the right amount of carbohydrate for one's metabolic type, not eating too often, and avoiding or limiting sugar and highly processed foods.

Counsels of perfection, on the other hand, include eating free-range eggs, organic fruits and vegetables, non-GMO produce, pastured meat, freedom-farmed pork, fresh produce rather than canned or frozen, fermented bread, sprouted grains, and so on. All of these things are desirable for various reasons, most are a change for the better nutritionally compared to the alternative, but, in an imperfect world where people struggle to make ends meet and time is tight, none should be considered essential for good health at a population level.

Tuesday 14 March 2017

The role of silicon in health and disease - is this the whole grain deficiency syndrome?


You can say what you like about whole grains, but their bran provides an excellent means of concentrating the element silicon from the soil in an absorbable form.
Silicon is required for the cross-linking of proteoglycans, the heavily glycosylated protein structures that give tissues as diverse as hair, nails, cartilage, bones, and aortas their resilience.
"The major biological function of proteoglycans derives from the physicochemical characteristics of the glycosaminoglycan component of the molecule, which provides hydration and swelling pressure to the tissue enabling it to withstand compressional forces."[1]

With this in mind, you'd think that conventional nutritionists would make more of whole grains as a source of silicon. Heck, you'd think they'd make something of it. But to do that would involve, first, acknowledging that silicon is an essential mineral in humans, which seems to have become one of those too-long-delayed "consensus" calls where no-one wants to be the odd one out. And secondly, it would involve recognising that fibre of the bran type may be conditionally beneficial for reasons that have nothing to with its effect on the microbiome, and that aren't specific to whole grains at all.

The advantage of considering the silicon hypothesis, for the whole grain nutritionist, is that it may provide an explanation for inconsistencies in the evidence for the fibre hypothesis, in that populations deficient in silicon from other sources may benefit from added fibre, while silicon-replete populations may not, and that grains grown in low-silicon soils may be less beneficial.

Klaus Schwarz (1914-1978 - he had discovered the essentiality of selenium in 1957) pioneered the study of silicon cross-linking in 1973.[2] In 1977, in The Lancet, after studying the association between the silicon content of drinking water in Finland with cardiovascular disease, Schwarz proposed that the silicon content of fibre was responsible for its correlation with cardiovascular disease.[3] Here's the abstract.

"A logical argument can be made for the hypothesis that lack of silicon may be an important aetiological factor in atherosclerosis. As silicic acid or its derivatives, silicon is essential for growth. It is found mainly in connective tissue, where it functions as a cross-linking agent. Unusually high amounts of bound silicon are present in the arterial wall, especially in the intima. Various kinds of dietary fibre have been reported to be effective in preventing experimental models of atherosclerosis, reducing cholesterol and blood-lipid levels, and binding bile acids in vitro. Exceptionally large amounts of silicon (1000 to 25 000 p.p.m.) were found in fibre products of greatly varying origin and chemical composition which were active in these tests. Inactive materials, such as different types of purified cellulose, contained only negligible quantities of the element. It is concluded that silicate-silicon may be the active agent in dietary fibre which affects the development of atherosclerosis. Two out of three samples of bran also had relatively low levels, which could explain why bran does not lower serum-cholesterol. The fact that atherosclerosis has a low incidence in less developed countries may be related to the availability of dietary silicon. Two instances are presented where silicon is reduced by industrial treatment: white flour and refined soy products were much lower in silicon than--their respective crude natural products. The chemical nature of silicon in different types of fibre is not known. It could exist as orthosilic acid, polymeric silicic acid, colloidal silica (opal), dense silica concentrations, or in the form of organically bound derivatives of silicic acid (silanolates). Possible mechanisms of action are discussed."

In a letter to the Lancet that same year, Schwarz and colleagues (including two researchers from the Finnish Heart Association) proposed that different levels of silicon in drinking water between West and East Finland are a factor in the different rates of heart disease between those populations.[4]
Water in West Finland had a silicon content of 7.73 +/- 0.53 mcg/ml (range 4.40-12.20), whereas water from East Finland had a silicon content of 4.80 +/- 0.27 mcg/ml (range 2.46-7.62). Schwarz's Finnish colleagues, as well as other Finnish researchers, found a similar difference in the magnesium and chromium content of the two water supplies, and that copper levels in East Finland were much higher than in the West.[5,6] CHD deaths in East Finland up to this period were about double those in the West, of course this difference was a subject of the famous 7 Countries study. We also know today that the rate of ApoE4 allele is significantly higher in the Eastern population.

The Finnish dietary change that is credited with reducing CHD incidence, most markedly in Eastern Finland, of course included an increased intake of whole grain fibre and bran, as well as the increased use of other foods grown outside Eastern Finland, as well as the reduced consumption of sugar and highly saturated animal fats. Food grown in New Zealand probably has a low silicon content due to the prevalence of volcanic rocks (for this reason New Zealand soil, like that of Eastern Finland, is very low in selenium, but unlike in Finland crop supplementation has not been used to correct this).[7] Data about silicon in New Zealand food or water is not available, but the silicon content of the water from volcanic lakes in New Zealand can be lower than 0.1 mcg/ml, too low to support diatomic life, which requires silicon to synthesise the frustule cell wall.[8]

I became interested in silicon while trying to understand why some people, but not others, on low carb grain-free diets report weak nails that break easily. Silicon supplements in the form of horsetail (equisetum) extracts, as well as collagen, are the usual recommendations, so what were the best dietary sources? Definitely grains. Oat bran comes out on top; of course, if you're not coeliac you can include this in low carb cooking. Bean pods (green or runner beans) are a good source. Spinach too. But as silicon is incorporated into cartilage and bone and recognised as essential for chicken growth, bone broth is a good source for carnivores, and as it supplies hydrolysed collagen probably also reduces silicon requirements. Beer is an excellent source, if you like low carb beer, as of course is mineral water.[9,10] Dandelion, nettle, oatstraw and horsetail are cheap herb teas very high in silicon.
As a general rule, hard water, and the hard parts of plants and animals, are where silicon is concentrated. Silicon is another line of evidence supporting the idea of bone and connective tissue as "animal fibre".

Are there any experimental tests of the idea? Silicon supplements definitely improve the resilience of hair and nails in humans.[11] In animals, silicon protects cholesterol-fed rabbits from atherosclerosis, but not cholesterol-fed ApoE knockout mice.[12,13] But - is there any evidence that fibre prevents atherosclerosis in such extreme models, apart from the effects of specific fibres such as chitosan on cholesterol absorption?

On reading Schwarz's papers and corresponding with him, Bassler wrote in a letter to the BMJ,[14]

"Our interest in the "Schwarz hypothesis"
was stimulated by his analysis of hair samples
from cardiac patients (unpublished observations).
We submitted samples from cardiac
patients, marathon runners, and patients who
were in exercise rehabilitation programmes.
Some cardiac patients who were disabled by
musculoskeletal injuries during training had
"very low" levels of hair silicon (under 4 ppm).
Normal levels were found in champion
marathon runners (over 20 ppm). Patients who
were supplementing their diets with bran and
alfalfa had elevated levels (up to 100 ppm).
These results suggest that silicon is the
"hard water factor" and the "food fibre
factor." We now advise cardiac patients to
increase their fibre intake until their stools
float. To date 102 cardiac patients have
"graduated" from rehabilitation programmes
by running 42 km.
Tabashir - a plant based opal formed from silicates in bamboo stems

What is interesting about this observation is that a normal barrier to exercise, susceptibility to connective tissue damage on running, appears to have been reduced by silicon supplementation.

We don't seem to know much more about silicon and CVD than we did in Schwarz's day; but we can be sure that CVD risk has decreased everywhere as the micronutrient content of the diet has improved, as non-seasonal and distant food sources have increased, which would be expected to improve silicon distribution, and as people have been encouraged to eat more whole foods; whereas, it is still high in individuals eating a high percentage of calories from nutrient-depleted foods such as sugar, flour, and oil.


Here's a Provisional Database of silicon in foods in UK Diet.[15]


References


[1] Yanagishita M. Function of proteoglycans in the extracellular matrix. Acta Pathol Jpn. 1993; 43(6):283-93.

[2] Schwarz K. A Bound Form of Silicon in Glycosaminoglycans and Polyuronides. Proceedings of the National Academy of Sciences of the United States of America. 1973;70(5):1608-1612.

[3] Schwarz K. Silicon, fibre, and atherosclerosis. Lancet. 1977; 26;1(8009):454-7.
http://sili.cium.free.fr/lancet.htm


[4] Schwarz, K, Ricci BA, Punsar S, Karvonen MJ. Inverse relation of silicon in drinking water and atherosclerosis in Finland. Lancet i., 538-539 (1977).

[5] Karppanen H, Pennanen R, Pasinen L. Minerals, Coronary Heart Disease and Sudden Coronary Death. Adv. Cardiol. 1978; 25:9-24. http://www.mgwater.com/minerals.shtml

[6] Punsar S, Karvonen MJ. Drinking Water Quality and Sudden Death: Observations from West and East Finland. Cardiology 1979; 64:24-34. http://www.mgwater.com/finland.shtml

[7] Alfthan G, Eurola M, Ekholm P et al. Effects of nationwide addition of selenium to fertilizers on foods, and animal and human health in Finland: From deficiency to optimal selenium status of the population.  J Trace Elem Med Biol. 2015;31:142-7. doi: 10.1016/j.jtemb.2014.04.009. Epub 2014 May 20.

[8] Pearson LK, Hendy CH, Hamilton DP. Dynamics of silicon in lakes of the Taupo Volcanic Zone, New Zealand, and implications for diatom growth. Inland Waters. 2016; 6(2), 185–198. http://doi.org/10.5268/IW-6.2.813

[9] Sripanyakorn S, Jugdaohsingh R, Dissayabutr W, Anderson SHC, Thompson RPH, Powell JJ. The comparative absorption of silicon from different foods and food supplements. The British journal of nutrition. 2009;102(6):825-834. doi:10.1017/S0007114509311757.

[10] Jugdaohsingh R, Tucker KL, Qiao N et al. Dietary silicon intake is positively associated with bone mineral density in men and premenopausal women of the Framingham Offspring cohort. J Bone Miner Res. 2004 Feb;19(2):297-307. Epub 2003 Dec 16.

[11] Jurkić LM, Cepanec I, Pavelić SK, Pavelić K. Biological and therapeutic effects of ortho-silicic acid and some ortho-silicic acid-releasing compounds: New perspectives for therapy. Nutrition & Metabolism. 2013;10:2. doi:10.1186/1743-7075-10-2.

[12] Loeper J, Goy-Loeper J, Rozensztajn L, Fragny M. The antiatheromatous action of silicon. Atherosclerosis. 1979 Aug; 33(4):397-408.

[13] Jugdaohsingh R, Kessler K, Messner B, et al. Dietary Silicon Deficiency Does Not Exacerbate Diet-Induced Fatty Lesions in Female ApoE Knockout Mice. The Journal of Nutrition. 2015;145(7):1498-1506. doi:10.3945/jn.114.206193.

[14] Bassler TJ. Hard water, food fibre, and silicon. British Medical Journal. 1978;1(6117):919.

[15] 
Powell JJ, McNaughton SA, Jugdaohsingh R et al. A provisional database for the silicon content of foods in the United Kingdom. British Journal of Nutrition. 2005; 94, 804–812.
http://sili.cium.free.fr/biblio/database_silicon_food_BJN2005.pdf

Further resources: http://sili.cium.free.fr/biblio.htm
Silicon for French speakers: http://sili.cium.free.fr/